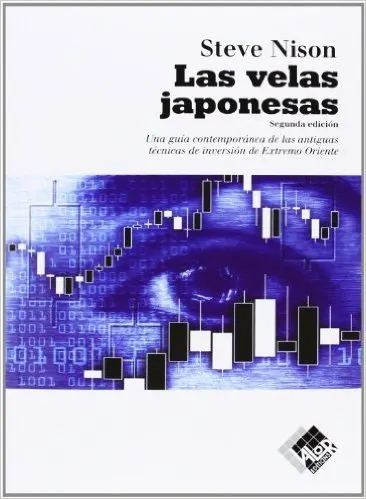
Cover of Japanese Candlestick Charting Techniques
Trading & technical analysis

Japanese Candlestick Charting Techniques

A Contemporary Guide to the Ancient Investment Techniques of the Far East, Second Edition

★★★★½ No ratings 1 min read

«Japanese Candlestick Charting Techniques», published in 1991, is the book that introduced Japanese candlestick analysis to Western financial markets.

Affiliate CTA preview · enabled with monetization (phase 5).

The book that introduced Japanese candlesticks to the West. Nison presents over fifty candlestick patterns — doji, hammer, morning star, engulfing — each explained with Japanese historical context, the market conditions in which it appears, and how to interpret it alongside Western technical analysis. Published in 1991, it transformed Western charting forever.

Our review

«Japanese Candlestick Charting Techniques», published in 1991, is the book that introduced Japanese candlestick analysis to Western financial markets. Steve Nison, an analyst who encountered these techniques while working in Japan for Dean Witter, systematised for the first time in English a collection of more than fifty candlestick patterns — doji, hammer, morning star, bearish engulfing — describing their formation conditions, interpretation, and reliability record. The book is the canonical reference text in the field: every subsequent work on candlesticks builds on the foundations established here. Its structure is pedagogical and progressive, with abundant real-market charts that make abstract patterns concrete. The main limitation, shared with all technical analysis literature, is that patterns must be contextualised: a hammer at a support zone carries very different implications from the same pattern in the middle of a sideways trend. The book acknowledges this, though less experienced readers sometimes overlook that nuance.

Who it's for

For any trader or technical analyst who wants to master Japanese candlestick fundamentals from the original source that introduced them to the West.

Key takeaways

  • An individual candlestick pattern is a hypothesis about the balance between buyers and sellers — not a deterministic signal.
  • Reversal patterns are most reliable when they appear at significant support or resistance zones and are confirmed by the following candle.
  • The doji — a candle where open and close are nearly identical — signals market indecision and only gains meaning from the preceding context.
  • Combining candlestick signals with volume and other technical indicators meaningfully improves signal reliability.
Fact

Steve Nison published «Japanese Candlestick Charting Techniques» in 1991; before this book, Japanese candlestick analysis was virtually unknown outside Japan in Western financial markets.